
Related News
- 00
0000-00
Utility Maximization for Shared Fleets: Which Data Inputs Matter Most? - 00
0000-00
Smart E-Scooter Systems With GPS for Shared Fleets: Features That Matter Most - 00
0000-00
Smart E-Scooter Systems in North America: What Fleet Buyers Should Evaluate First - 00
0000-00
How to Choose Shared Fleet Scooters for Operators: Range, Durability, and Service Needs - 00
0000-00
How to Choose Micro-Mobility Docking Stations for Shared Fleets and Public Charging Hubs
Urban Transit Fellow
Weekly Insights
Stay ahead with our curated technology reports delivered every Monday.
Utility Maximization for Shared Fleets: Which Data Inputs Matter Most?





In shared micro-mobility, utility maximization for shared fleets is no longer a simple routing exercise. It is a data discipline that decides whether vehicles spend more time earning, charging, waiting, or failing.
That matters across e-bikes, smart e-scooters, and emerging high-speed electric two-wheelers. As cities tighten curb rules and riders expect reliability, the quality of input data becomes a direct driver of margin and service quality.
For platforms tracking the Last-Mile Revolution, including intelligence hubs such as UMMS, the real question is not whether data is important. The harder question is which data inputs actually improve allocation, maintenance, charging, and long-term network design.
What utility means in a shared fleet
Utility is often reduced to ride count. That is too narrow for modern fleet economics.
In practice, utility maximization for shared fleets means balancing revenue hours, vehicle availability, rider satisfaction, regulatory compliance, battery health, and service cost. A vehicle with strong demand but poor uptime does not create full utility.
The same logic applies across categories. An e-bike network, a smart e-scooter program, and a battery-swapping e-motorcycle operation all depend on matching assets to time, place, condition, and rider intent.
That is why the best operators stop treating fleet data as a passive dashboard feed. They treat it as an operating system for daily decisions.
The inputs that matter most
Not every signal deserves equal weight. Some inputs create real predictive value, while others only add noise.
Demand by location and time
Historical trip density is the first essential layer. It shows where demand forms, how long it lasts, and how sharply it moves between commuting peaks, leisure hours, and weekend patterns.
Useful demand data should be segmented by zone, hour, day type, weather condition, and vehicle type. A downtown e-scooter profile rarely behaves like a suburban e-bike corridor.
Vehicle state-of-health
Utility maximization for shared fleets depends heavily on knowing which assets are truly deployable. Battery state-of-charge alone is not enough.
Operators need state-of-health indicators, motor efficiency drift, brake wear, controller fault history, tire condition, and thermal behavior. These signals separate usable inventory from inventory that only appears available.
This is especially relevant in electrified two-wheelers, where battery degradation and thermal stress can quietly reduce uptime before a full failure appears.
Charging and energy data
Charging data determines more than energy cost. It affects dispatch timing, labor requirements, swap logistics, and battery lifespan.
High-performing operators track charging duration, charger utilization, swap cycle intervals, battery temperature, idle time before recharge, and energy consumed per ride kilometer.
For utility maximization for shared fleets, energy data becomes strategic when it explains why two similar vehicles produce different operating returns.
Rider behavior signals
Trip completion rate, cancellation rate, repeat usage, parking compliance, ride duration, and complaint patterns all reveal hidden friction.
These inputs matter because demand is not only where people open the app. It is where the service experience is smooth enough to create repeat behavior.
External operating conditions
Weather, events, transit disruptions, subsidy shifts, right-of-way rules, and low-emission policies can all change utility faster than fleet size does.
This broader policy and environmental layer is often underestimated. Yet in shared mobility, regulatory context can determine which assets are profitable and where redeployment is justified.
Why the market is paying closer attention
The micro-mobility sector has moved past expansion by volume alone. More cities now expect tighter parking discipline, better safety outcomes, and lower street clutter.
At the same time, hardware is becoming more sophisticated. Smart e-scooters rely on IoT modules, e-bikes blend mechanical and electrical loads, and high-speed e-motorcycles introduce more demanding thermal and battery logic.
That shift raises the value of precise operational intelligence. Platforms like UMMS follow these changes because utility maximization for shared fleets now sits at the intersection of electromechanical design, urban policy, and real-time data use.
In other words, better fleets are increasingly built through better interpretation, not only better hardware.
Turning raw signals into decisions
The most useful data is the data that changes an action. That sounds obvious, but many teams still collect far more than they operationalize.
A practical decision model usually connects four questions: where to place vehicles, when to service them, how to charge them, and which assets should be retired or reassigned.
This is where utility maximization for shared fleets becomes concrete. The aim is not perfect prediction. The aim is faster, cleaner operating choices with fewer blind spots.
Category differences deserve separate models
A common mistake is using one input model for every vehicle class. That usually weakens results.
E-bikes are sensitive to gradient, rider effort patterns, and mixed leisure-commute usage. Smart e-scooters place more emphasis on curb behavior, short-trip churn, and geofencing compliance.
High-speed e-motorcycles bring heavier battery loads, stricter thermal demands, and different charging economics. Precision drivetrain components also matter where transmission efficiency affects range and maintenance intervals.
That is one reason sector intelligence is valuable. A fleet strategy informed by category-specific performance signals is usually more resilient than a generic mobility dashboard.
What to watch when building a data stack
More data does not guarantee better utility maximization for shared fleets. The structure of the data stack matters just as much.
- Check data freshness. Hour-old location data can distort repositioning decisions.
- Standardize definitions. Availability, uptime, and deployable inventory are often measured inconsistently.
- Link technical and commercial data. Ride revenue without maintenance cost hides weak assets.
- Separate leading indicators from lagging ones. Fault patterns matter earlier than monthly downtime totals.
- Account for policy volatility. Incentives and local restrictions can reshape profitable zones quickly.
Usually, the strongest systems begin with a small set of trusted signals, then expand once teams can act on them consistently.
A practical next step
A useful starting point is to rank every existing data input by decision impact. If a signal does not change allocation, charging, maintenance, or capital planning, it may not deserve priority.
Then compare asset classes, operating zones, and policy exposure side by side. That process often reveals why utility maximization for shared fleets succeeds in one market and stalls in another.
The wider micro-mobility market is moving toward tighter integration between hardware intelligence, battery management, and urban operating rules. The operators that learn to identify the right inputs early will make better decisions long before the dashboard looks impressive.
For any organization evaluating next moves, the priority is clear: establish which data inputs truly govern utility, test them against real operating scenarios, and build decisions around evidence rather than volume.
Related News
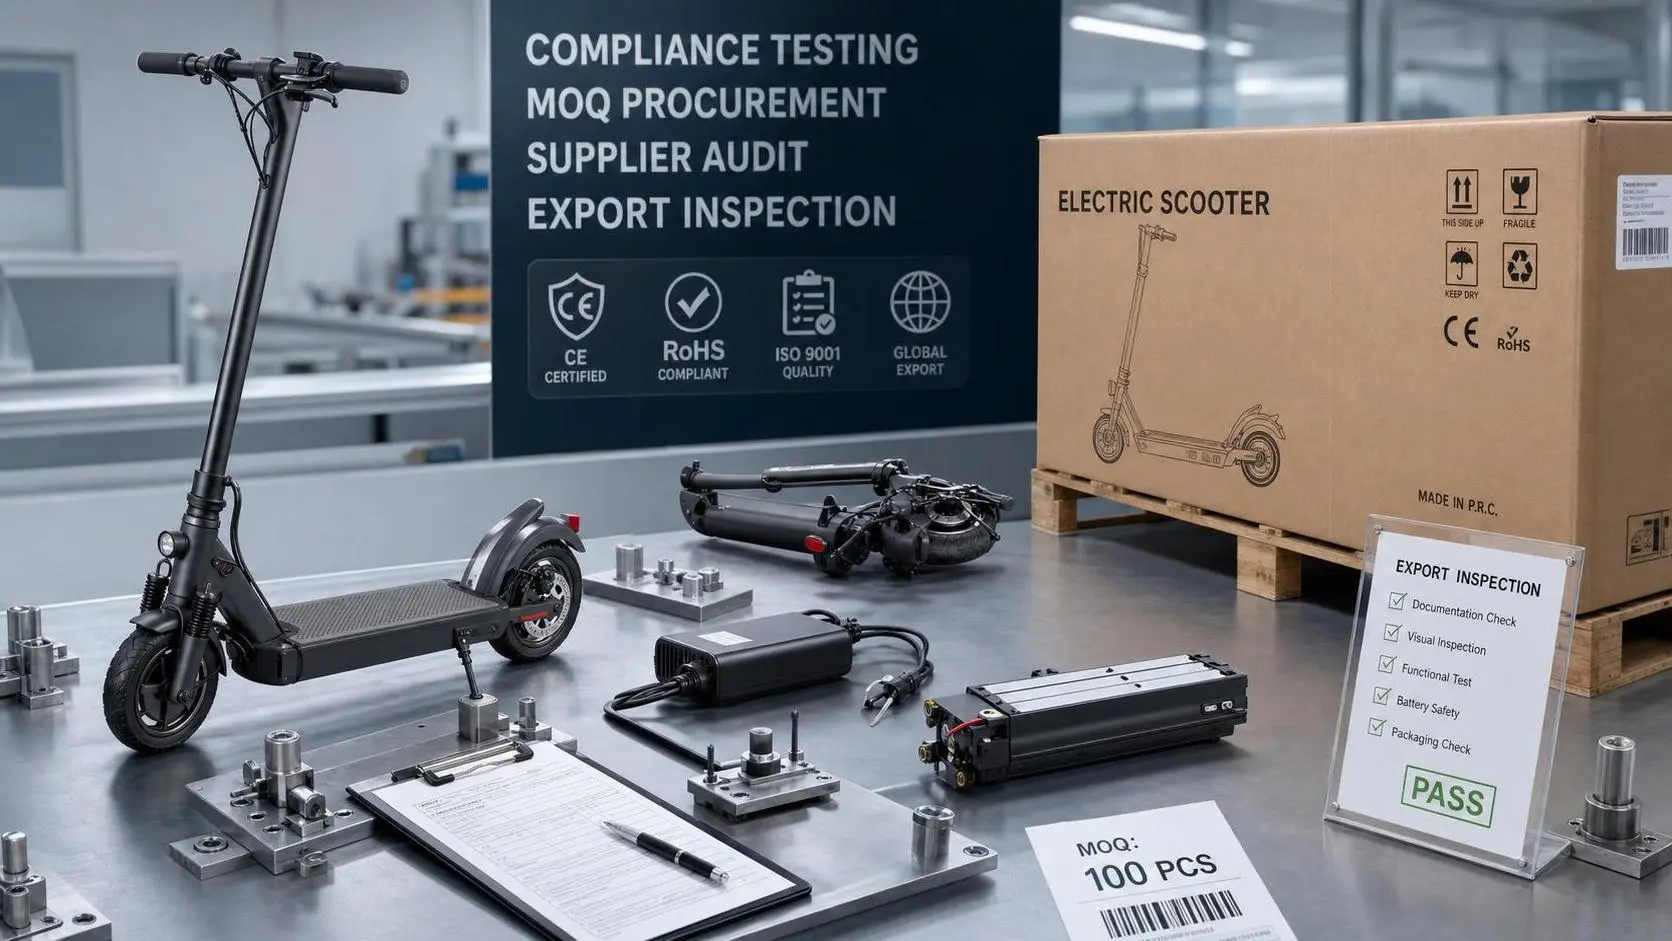
Private Label Electric Scooters in Europe: Compliance, MOQ, and Supplier Checks
Private label electric scooters Europe: learn compliance checks, realistic MOQ structures, and supplier screening tips to reduce risk, protect margins, and launch with confidence.

How to Evaluate Decarbonization Technology Suppliers for Industrial Projects
Decarbonization technology suppliers can make or break industrial projects. Learn how to assess technical fit, emissions credibility, delivery risk, and lifecycle value.
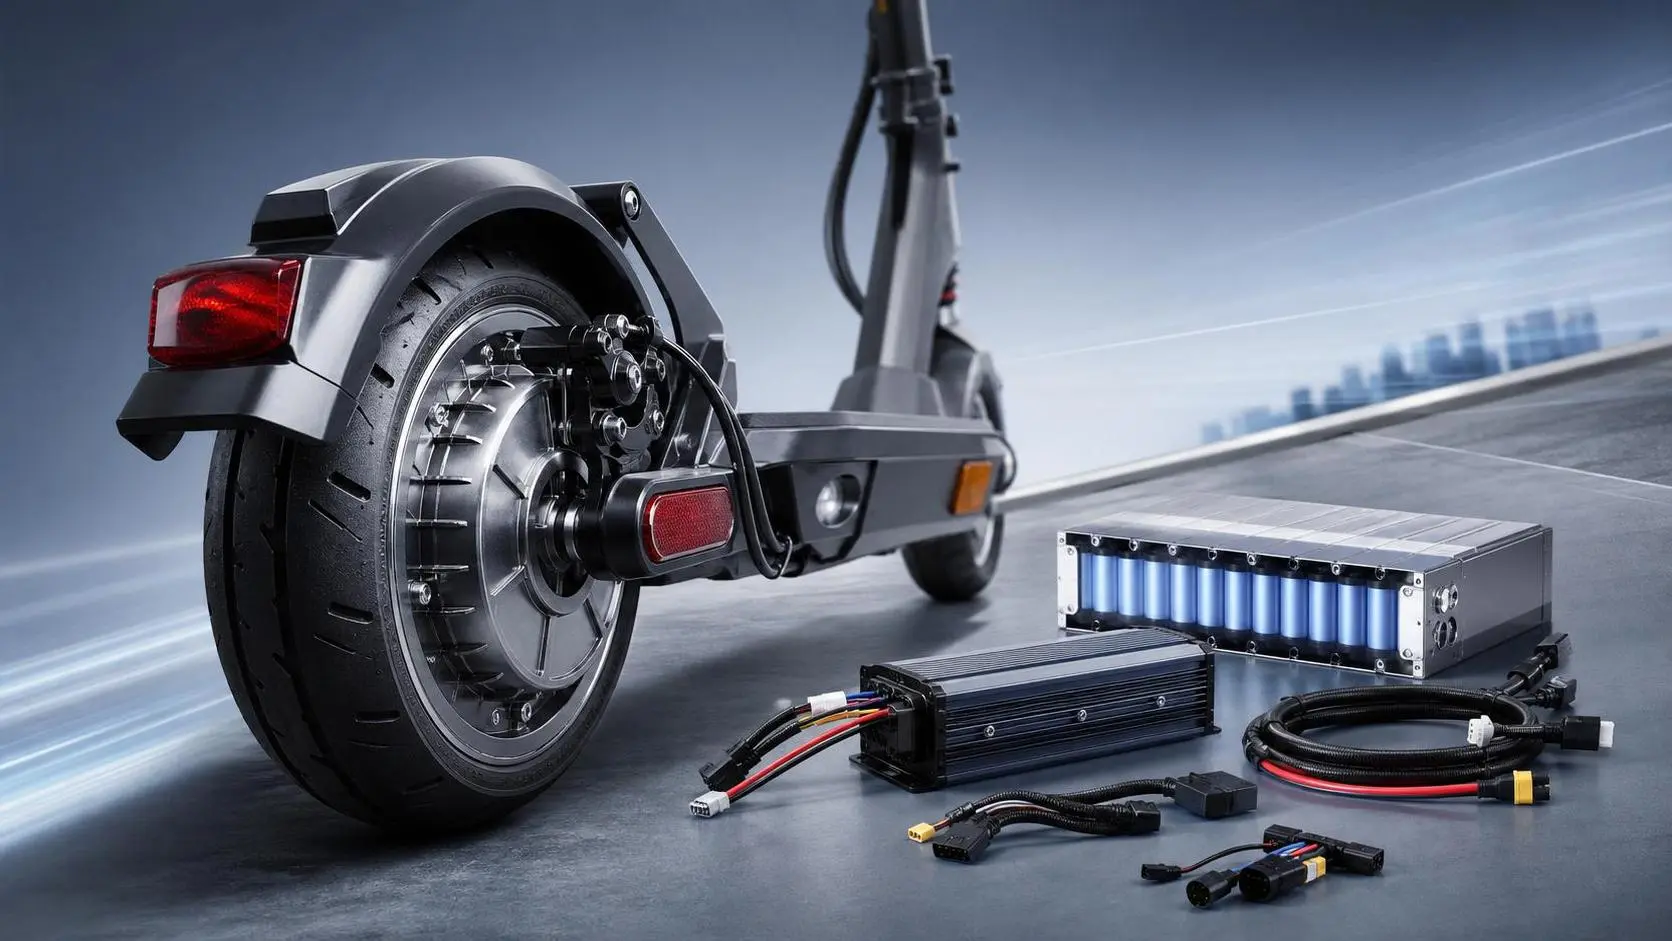
Brushless Motor for Scooters: How to Compare Power, Torque, and Efficiency
Brushless motor for scooters comparison made simple: learn how to evaluate power, torque, and efficiency for better range, stronger climbs, and smarter urban performance.

How to Choose OEM Windshield Wipers for Private Label Auto Parts Programs
OEM windshield wipers buying guide for private label auto parts: compare fitment, materials, testing, supplier reliability, and hidden cost risks to build a safer, higher-margin program.

Smart E-Scooter Systems With GPS for Shared Fleets: Features That Matter Most
Smart e-scooter systems with GPS help shared fleets improve compliance, recovery, uptime, and battery planning. See which features matter most before you scale.

Vehicle Visibility Safety for Motorcycles: Common Blind-Spot Risks and Fixes
Vehicle visibility safety for motorcycles explained: discover common blind-spot risks in city, wet, cargo, and high-speed riding, plus practical fixes that improve safety and fleet performance.
Flat Wiper Blades Europe: What to Check Before Choosing OEM or Aftermarket Options
Flat wiper blades Europe buyers should look beyond price. Learn how to compare OEM and aftermarket options by fit, compliance, durability, and supply consistency.
Automatic Smart Wiper Systems Explained: Sensors, Control Logic, and Failure Points
Automatic smart wiper systems explained clearly: explore sensors, control logic, key failure points, and what really determines safer, more reliable windshield visibility.
How to Use a Smart Mobility Supplier Directory to Compare OEM Partners
Smart mobility supplier directory guide: compare OEM partners beyond price by checking compliance, battery integration, lead times, and engineering strength to build a lower-risk shortlist.