
Related News
- 00
0000-00
Mobility Efficiency Analysis: How to Measure Vehicle Use, Energy Cost, and Route Productivity - 00
0000-00
How to Evaluate a Brushless Wiper Motor Supplier for OEM Quality and Lead Time - 00
0000-00
How Do Photoelectric Wiper Sensors Work and Where Are They Most Effective? - 00
0000-00
How to Evaluate Core Component Suppliers for Electric Motorcycles Before Sourcing? - 00
0000-00
Electric Motorcycle Systems Price Breakdown: What Affects Cost From Battery to Controller?
Ms. Elena Rodriguez
Weekly Insights
Stay ahead with our curated technology reports delivered every Monday.
Mobility Efficiency Analysis: How to Measure Vehicle Use, Energy Cost, and Route Productivity





Mobility Efficiency Analysis Is Not Just About Mileage
In micro-mobility, people often talk about efficiency as if it were a single number: lower energy use, higher utilization, shorter trip time. That is too narrow to be useful. A serious mobility efficiency analysis asks a harder question: how much practical movement, revenue-generating service, or urban transport value is being created from each vehicle, each battery cycle, each route window, and each hour of fleet availability?
That distinction matters in e-bikes, smart e-scooters, and high-speed electric two-wheelers because the operating logic is different from passenger cars or heavy fleets. Vehicles are lighter, trip distances are shorter, charging behavior is less uniform, and route conditions change quickly with weather, terrain, curbside rules, rider behavior, and local traffic micro-circulation. A vehicle can look efficient on a spec sheet and still underperform badly in service if it spends too much time idle, consumes disproportionate energy on stop-and-go routes, or cycles through batteries in a way that increases replacement cost.
So when operators, OEMs, component suppliers, or urban mobility planners discuss mobility efficiency analysis, they are usually trying to connect three layers that are often measured separately: vehicle use, energy cost, and route productivity. The value of the analysis is not in producing dashboards. It is in revealing where the system leaks performance.
What the Term Really Means in Practice
At a practical level, mobility efficiency analysis is a method for evaluating whether a mobility asset is being used in a way that matches its design purpose and economic role. For a shared e-scooter fleet, that may mean understanding trips per vehicle per day, energy consumed per completed trip, average downtime between rides, and the proportion of fleet inventory unavailable due to charging, repositioning, maintenance, or geofencing restrictions. For an e-bike brand selling into delivery or commuter use, the same concept may shift toward battery discharge behavior, rider assist patterns, terrain sensitivity, and maintenance intervals for drivetrain components under real riding load.
The word “efficiency” therefore sits at the intersection of engineering and operations. It is not only about motor efficiency curves or battery chemistry performance, although those matter. It is also about whether route design, duty cycle, charging strategy, and fleet management decisions are aligned with the physical characteristics of the vehicle.
This is where many decision-makers get tripped up. They compare vehicles by nominal range, rated power, or battery capacity, then assume those numbers translate cleanly into operational advantage. In reality, route topology, rider payload, climate, regenerative braking logic, tire pressure, maintenance discipline, and software limits can alter real-world efficiency far more than a brochure comparison suggests.
The Three Measurements That Matter Most
If the goal is to measure mobility performance in a way that supports decisions, three dimensions deserve priority.
- Vehicle use: how often the asset moves, how long it remains available, and whether its service hours match demand peaks.
- Energy cost: how much electricity is required to generate each unit of transport work, including the operational consequences of charging losses, battery aging, and inefficient duty cycles.
- Route productivity: how much useful transport output a route produces relative to time, distance, energy, and congestion constraints.
These are not interchangeable. A scooter can have high utilization but weak route productivity if it is repeatedly deployed in zones with short, low-value trips and long retrieval intervals. An e-motorcycle can post good route productivity but poor energy economics if its high-speed operation or thermal management burden creates a costly charging pattern. An e-bike used in logistics can look cheap to operate until the data shows battery swaps and drivetrain wear are concentrated on a small group of heavily loaded routes.
How to Measure Vehicle Use Without Misreading the Numbers
Utilization is one of the most abused metrics in mobility. Counting total trips or total mileage is easy, but those figures hide more than they reveal. A vehicle that logs many short trips may be productive in a dense downtown context, or it may be trapped in a low-margin service pattern with excessive idle gaps. What matters is not just activity, but quality of activity.
A more useful approach is to separate vehicle use into availability, engagement, and burden. Availability asks whether the vehicle is ready for service when demand exists. Engagement looks at actual ride or mission time relative to total available time. Burden captures the non-productive hours consumed by charging, maintenance, relocation, fault handling, or regulatory compliance actions.
For micro-mobility systems connected through IoT modules, this analysis usually relies on timestamped trip logs, battery state data, service records, and geospatial routing history. The point is not to collect every conceivable signal. It is to identify where vehicle time is being lost. In many operations, idle time is not a passive condition; it is an indicator of bad placement, misaligned fleet size, poor charging orchestration, or route demand that has been misunderstood.
Energy Cost Is More Than Power Consumption
When people hear “energy cost,” they often reduce it to electricity price per kilowatt-hour. That is incomplete, especially for electric two-wheelers. The real energy cost of mobility includes conversion losses, charging behavior, battery degradation exposure, thermal conditioning requirements in some vehicle classes, and the operational consequences of low state-of-charge events.
In a shared or commercial fleet, two routes with similar distance can produce very different energy profiles. Repeated acceleration from low speed, hill climbing, cold-weather performance loss, and rider weight distribution all affect consumption. For e-bikes and e-scooters, support mode selection, tire condition, and braking frequency can materially shift usable range. For higher-speed electric motorcycles, sustained speed and thermal load may matter more than trip distance alone.
That is why good mobility efficiency analysis rarely stops at “energy per kilometer.” It often looks for energy per completed trip, energy per payload condition, energy per service hour, or energy per revenue event. Those ratios are much closer to how businesses actually absorb cost.
Battery management is especially important here. A fleet that appears efficient on daily energy draw may still be expensive if charging habits accelerate battery aging or create frequent swap labor. In other words, lower immediate electricity use does not always mean lower lifetime energy cost.
Route Productivity Is the Hardest Part, and Usually the Most Valuable
Route productivity is where mobility efficiency analysis becomes strategically useful. It asks whether the route itself justifies the asset and energy committed to it. That sounds obvious, but many organizations still evaluate routes with inherited assumptions from conventional fleet management, where longer distance may imply more output. In micro-mobility, that relationship is weaker.
A productive route in an urban last-mile network is not necessarily the fastest or the longest. It is the route that converts time, battery, and asset availability into reliable service with minimal friction. For commuter applications, that may mean high trip completion consistency during peak windows. For delivery use, it may mean stable stop density and low detour exposure. For shared fleets, it may mean a service zone where repositioning effort remains proportionate to ride demand.
This is also where urban policy enters the picture. Right-of-way restrictions, parking rules, speed caps, no-ride zones, and local safety requirements can change route productivity without changing the vehicle itself. Decision-makers who ignore regulatory geometry often misdiagnose an operational problem as a hardware problem.
A Useful Framework for Decision-Makers
For strategic planning, it helps to treat mobility efficiency analysis as a layered review rather than a single KPI exercise.
This type of framework is particularly relevant in the UMMS coverage universe, where electromechanical transmission efficiency, battery management logic, lightweight structures, and urban operating constraints all interact. Looking at only one layer leads to distorted decisions. A route issue becomes a battery issue. A maintenance issue gets blamed on rider demand. A component mismatch is mistaken for poor market adoption.
Common Misreadings of the Analysis
One common mistake is treating all trips as equal. They are not. Short, dense, repeatable trips in a compliant operating zone may be more valuable than longer trips that strain batteries and trigger more service intervention.
Another is assuming higher utilization always means a healthier operation. In some fleets, extreme utilization may signal under-capacity, deferred maintenance, or battery stress that will surface later as service failure and replacement cost.
There is also a tendency to separate hardware analysis from route analysis. In reality, drivetrain precision, braking behavior, frame weight, control software, and battery management all shape route productivity. This is especially true in two-wheeler electrification, where relatively small changes in component efficiency can alter real service output.
And finally, decision-makers sometimes over-trust benchmark figures without checking comparability. Data gathered from different climates, rider profiles, traffic conditions, or charging regimes is not automatically transferable. Efficiency claims only become meaningful when the operating context is clear.
What a Good Analysis Should Help You Decide
A well-built mobility efficiency analysis should support concrete decisions: whether a fleet is oversized or undersized, whether a battery architecture fits the route network, whether shared vehicles are positioned in the right zones, whether component upgrades will pay back operationally, and whether a market expansion plan is based on real transport logic rather than headline demand.
For OEMs and core component suppliers, the same analysis can sharpen product strategy. It can indicate that the next advantage will not come from headline motor power, but from better control algorithms, improved thermal behavior, lighter transmission losses, or more predictable maintenance intervals. For operators, it often exposes that the biggest gains are not in buying more vehicles, but in reducing idle hours, preventing battery misuse, and redesigning routes around actual city behavior.
The term may sound analytical, but its business use is straightforward. Mobility efficiency analysis is a way of forcing vehicle technology, operating economics, and urban reality into the same conversation. In micro-mobility, that is usually where the real answer is hiding.
- e-bikes
- smart e-scooters
- two-wheeler electrification
- battery management
- thermal management
- IoT modules
- electromechanical transmission
- electric two-wheelers
- core component suppliers
- micro-mobility
- electric motorcycles
- mobility efficiency analysis
- electromechanical transmission efficiency
- micro-mobility systems
Related News

How to Evaluate a Brushless Wiper Motor Supplier for OEM Quality and Lead Time
Brushless wiper motor supplier selection made easier: learn how to assess OEM quality, engineering support, compliance, and lead time to reduce sourcing risk.

How Do Photoelectric Wiper Sensors Work and Where Are They Most Effective?
Photoelectric wiper sensors explained: learn how they detect rain, reduce false triggers, and deliver the best visibility gains in urban EVs, e-bikes, fleets, and smart mobility.

How Battery-Swapping Networks Reduce Downtime in Shared Fleet Scooter Operations
Battery-swapping networks cut scooter fleet downtime by speeding field turnaround, improving uptime in peak zones, and helping operators optimize labor, battery rotation, and service efficiency.
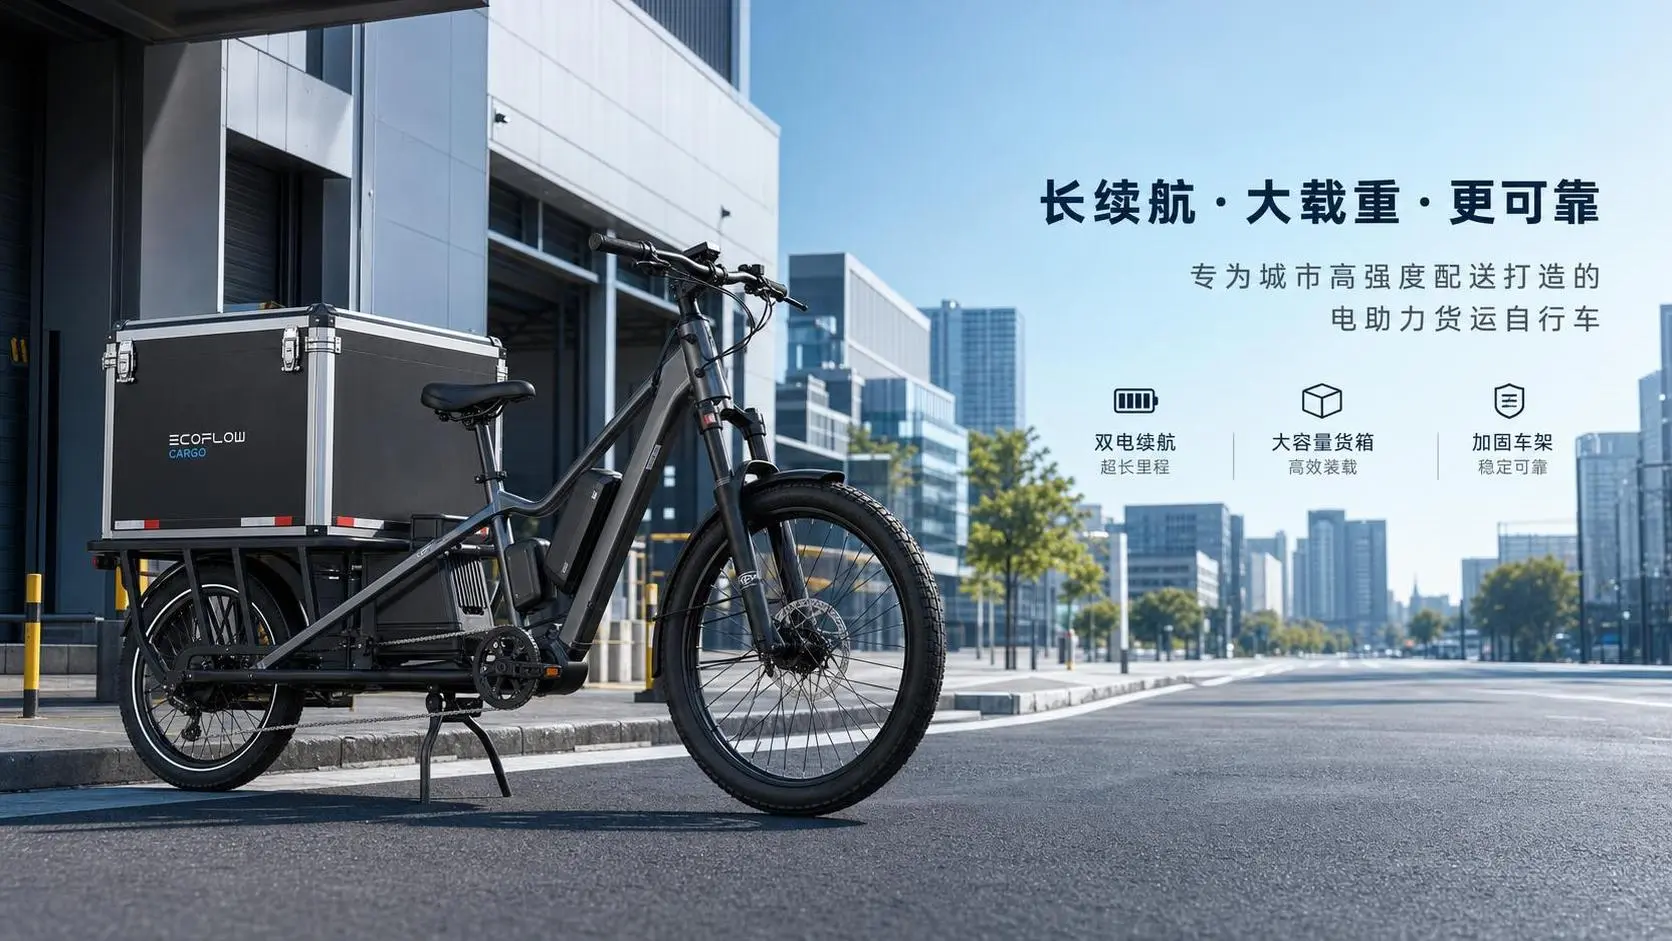
How to Choose a Long-Range Commercial Cargo E-Bike for Delivery Operations
Commercial cargo e-bike long range buying guide: learn how to assess battery, payload, route fit, and uptime support to choose a reliable delivery model with lower operating costs.

How to Select the Right E-Bike Battery Components for Range, Safety, and Fit?
E-bike component selection battery guide: learn how to choose the right battery components for better range, stronger safety, and perfect fit across modern e-bike platforms.

How to Evaluate Core Component Suppliers for Electric Motorcycles Before Sourcing?
Core component suppliers for electric motorcycles can make or break safety, compliance, and delivery. Learn how to assess technical strength, certifications, quality control, and hidden sourcing risks before you buy.

E-Bike Incentives Explained: How Riders Can Find Local Rebates and Tax Credits
E bike incentives explained: learn how to find local rebates, tax credits, and utility offers, avoid common mistakes, and cut the real cost of your next e-bike.
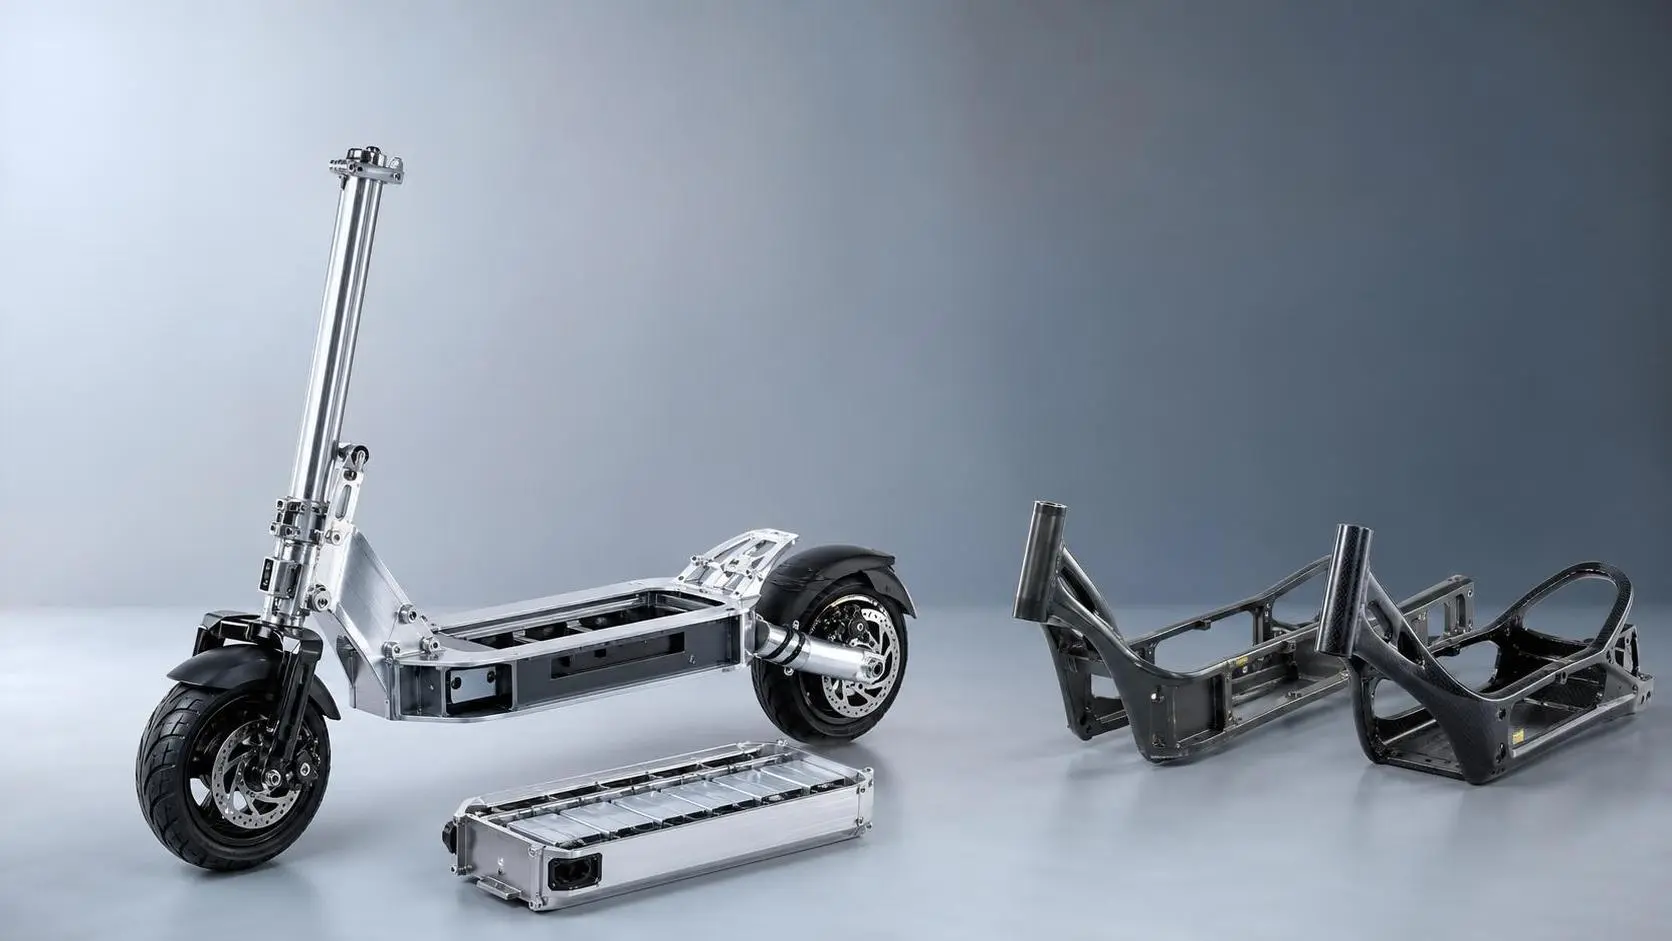
How to Choose Lightweight Scooter Frames in Europe: Materials, Standards, and Use Cases
Lightweight scooter frames Europe buyers need should balance materials, EN standards, durability, and real use cases. Discover how to choose safer, smarter, compliant frames.
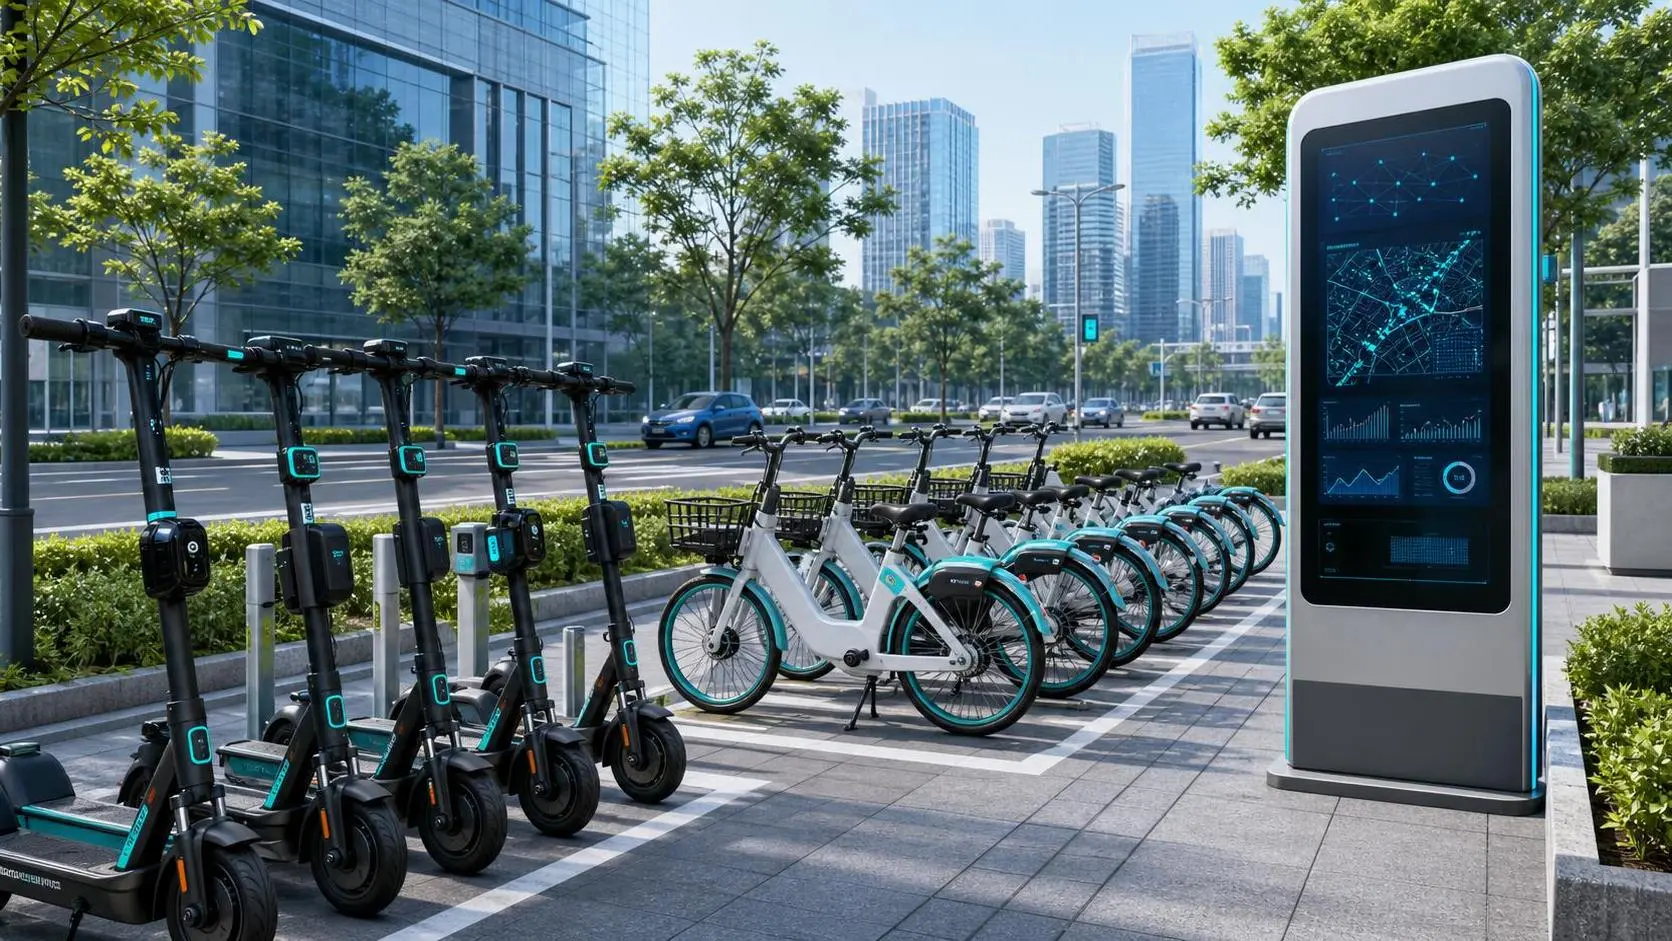
What Is the Intellectualization of Mobility Platform and How Is It Applied in Shared Fleets?
Intellectualization of mobility platform is reshaping shared fleets with real-time data, predictive maintenance, and smarter compliance—learn how it boosts safety, uptime, and urban mobility efficiency.