
Related News
- 00
0000-00
Micro-mobility Systems Explained: Core Components, Operating Models, and City Use Cases - 00
0000-00
Electrification Strategies in Europe: Policy, Charging, and ROI Factors for Fleet Planning - 00
0000-00
OEM Market Share in Electric Motorcycles: What It Reveals About Brand Positioning - 00
0000-00
What Is a Smart Transportation Platform and Which Urban Mobility Use Cases Fit Best? - 00
0000-00
How to Plan Micro-Mobility Charging Stations: Site Selection, Power Needs, and ROI
Ms. Elena Rodriguez
Weekly Insights
Stay ahead with our curated technology reports delivered every Monday.
Electrification Strategies in Europe: Policy, Charging, and ROI Factors for Fleet Planning





Why are electrification strategies Europe now a board-level fleet question?
Fleet electrification in Europe has moved beyond image and entered capital planning. Energy cost volatility, low-emission zones, and reporting pressure are reshaping operating models.
That is why electrification strategies Europe are no longer just about replacing vehicles. They now involve policy timing, charging access, asset life, and route fit.
In practical terms, the strongest plans connect vehicle choice with infrastructure readiness and cash-flow logic. A cheap vehicle can become expensive if charging downtime is ignored.
This is especially visible in urban mobility and light fleet operations. E-bikes, smart e-scooters, and high-speed e-motorcycles can outperform larger EVs on short routes.
UMMS tracks this shift closely through its micro-mobility intelligence work. Its research focus on batteries, drivetrains, right-of-way rules, and urban demand helps clarify where electrification is actually scalable.
The central question is not whether Europe is electrifying. It is how to build an electrification roadmap that still makes financial sense after incentives change.
What should be included in a realistic electrification plan, beyond the vehicle itself?
A realistic plan starts with fleet duty cycles. Distance, payload, stop frequency, elevation, parking dwell time, and seasonality all matter more than brochure range.
For many urban applications, electrification strategies Europe work best when fleets are segmented. Not every route needs the same powertrain or charging model.
A mixed fleet may be the better answer. E-bikes cover dense centers, e-scooters handle service hops, and higher-speed e-motorcycles support longer urban corridors.
The supporting system also needs attention. Charging hardware, site permissions, telematics, maintenance training, battery replacement policy, and driver behavior all affect outcomes.
A useful screening framework looks like this:
This is where many projects become more disciplined. A fleet transition succeeds when the vehicle, charger, software, and operating rhythm are designed together.
How much do policy incentives really change the business case?
They matter, but not always in the same way. Some incentives reduce upfront cost. Others improve tax treatment, speed permits, or preserve access to restricted urban zones.
When evaluating electrification strategies Europe, it is better to separate structural value from temporary support. Structural value comes from lower energy, lower maintenance, and better route productivity.
Temporary support includes grants, bonus depreciation, purchase rebates, or local charging subsidies. These can accelerate adoption, but they should not be the only reason to invest.
The more important policy question is durability. How long will the rule remain in place, and what happens if it is reduced next year?
A sound approach is to model two cases. One case includes current incentives. The second case assumes partial withdrawal and tests whether payback still remains acceptable.
For micro-mobility fleets, local rules can be as important as national programs. Access rights for shared scooters, battery handling standards, and parking regulations often shape utilization more than subsidy size.
UMMS reporting is useful here because policy signals rarely stand alone. They interact with urban congestion, carbon targets, and demand for lighter electric platforms.
Charging readiness: where do projects usually slow down?
Charging is often treated as a technical detail. In reality, it is one of the main reasons fleet electrification misses operational targets.
The first bottleneck is site power availability. Depot space may exist, but grid capacity, permitting timelines, and landlord approvals can delay deployment for months.
The second bottleneck is charging behavior. Vehicles do not charge on paper schedules. They charge when drivers return late, batteries run hotter, or routes change unexpectedly.
For this reason, electrification strategies Europe often need buffer capacity. That may mean spare chargers, battery-swapping logic, or route staggering across the day.
Smaller electric platforms create different choices. E-bikes and e-scooters may use removable batteries, while high-speed e-motorcycles may justify dedicated charging bays or swap systems.
A practical readiness checklist usually includes:
- Actual daily energy demand, not nominal battery size
- Peak simultaneous charging load at each site
- Downtime cost if a charger fails
- Battery storage and safety procedures
- Software visibility into state of charge and utilization
More mature operators build charging around service continuity, not around hardware count. That distinction usually improves uptime faster than buying larger batteries.
How should ROI be calculated when comparing electric fleets with existing assets?
Simple purchase-price comparisons are misleading. ROI should be measured across total cost of ownership, revenue continuity, and asset flexibility over time.
For electrification strategies Europe, the most reliable models usually include seven cost layers: vehicle acquisition, charging equipment, installation, energy, maintenance, labor impact, and battery end-of-life treatment.
Residual value also deserves attention. The resale market for some electric two-wheelers is strengthening, but it varies by battery health transparency and service history.
The hidden variable is utilization. If electric assets spend more time available in dense urban zones, they may produce better economics even with higher capital cost.
A useful ROI comparison table should answer very specific questions:
In many European cities, lighter electric vehicles reach payback earlier than expected because parking friction, congestion, and delivery density create productivity gains.
Which mistakes create the most risk in electrification strategies Europe?
One recurring mistake is copying another fleet’s configuration without matching route logic. What works for parcel delivery may fail in field service or hospitality operations.
Another issue is buying for maximum range when average range is the real requirement. Oversized batteries raise capital cost and can reduce the financial advantage.
A third mistake is underestimating maintenance learning curves. Electric fleets have fewer moving parts, but they still require battery diagnostics, firmware discipline, and parts planning.
There is also a compliance risk. Battery transport, urban parking rules, and right-of-way restrictions can limit deployment if reviewed too late.
For two-wheeler electrification, another blind spot is component quality. Drivetrain efficiency, thermal management, and electronic control stability can materially change operating cost.
That is why intelligence platforms such as UMMS matter in the evaluation process. They connect policy shifts with technical realities instead of treating them as separate topics.
What is the sensible next step if a fleet plan is still at the evaluation stage?
Start with one route-level baseline, not a headline target. Measure distance, dwell time, payload, maintenance events, and current fuel or service cost for a representative operating week.
Then build two or three electrification scenarios. One should use current incentives, one should assume reduced support, and one should test a mixed micro-mobility fleet.
At that stage, charging feasibility should be checked in parallel with vehicle selection. Waiting until after procurement usually creates avoidable delay.
The strongest electrification strategies Europe are disciplined, local, and data-led. They match policy timing, charging reality, and ROI assumptions to actual urban operating conditions.
For organizations tracking last-mile mobility, two-wheel electrification, and precision component trends, a structured intelligence source can shorten the learning curve and improve planning quality.
The next move is straightforward: define the fleet segment, test the charging model, compare five-year economics, and confirm where policy support adds value without becoming the whole case.
Related News
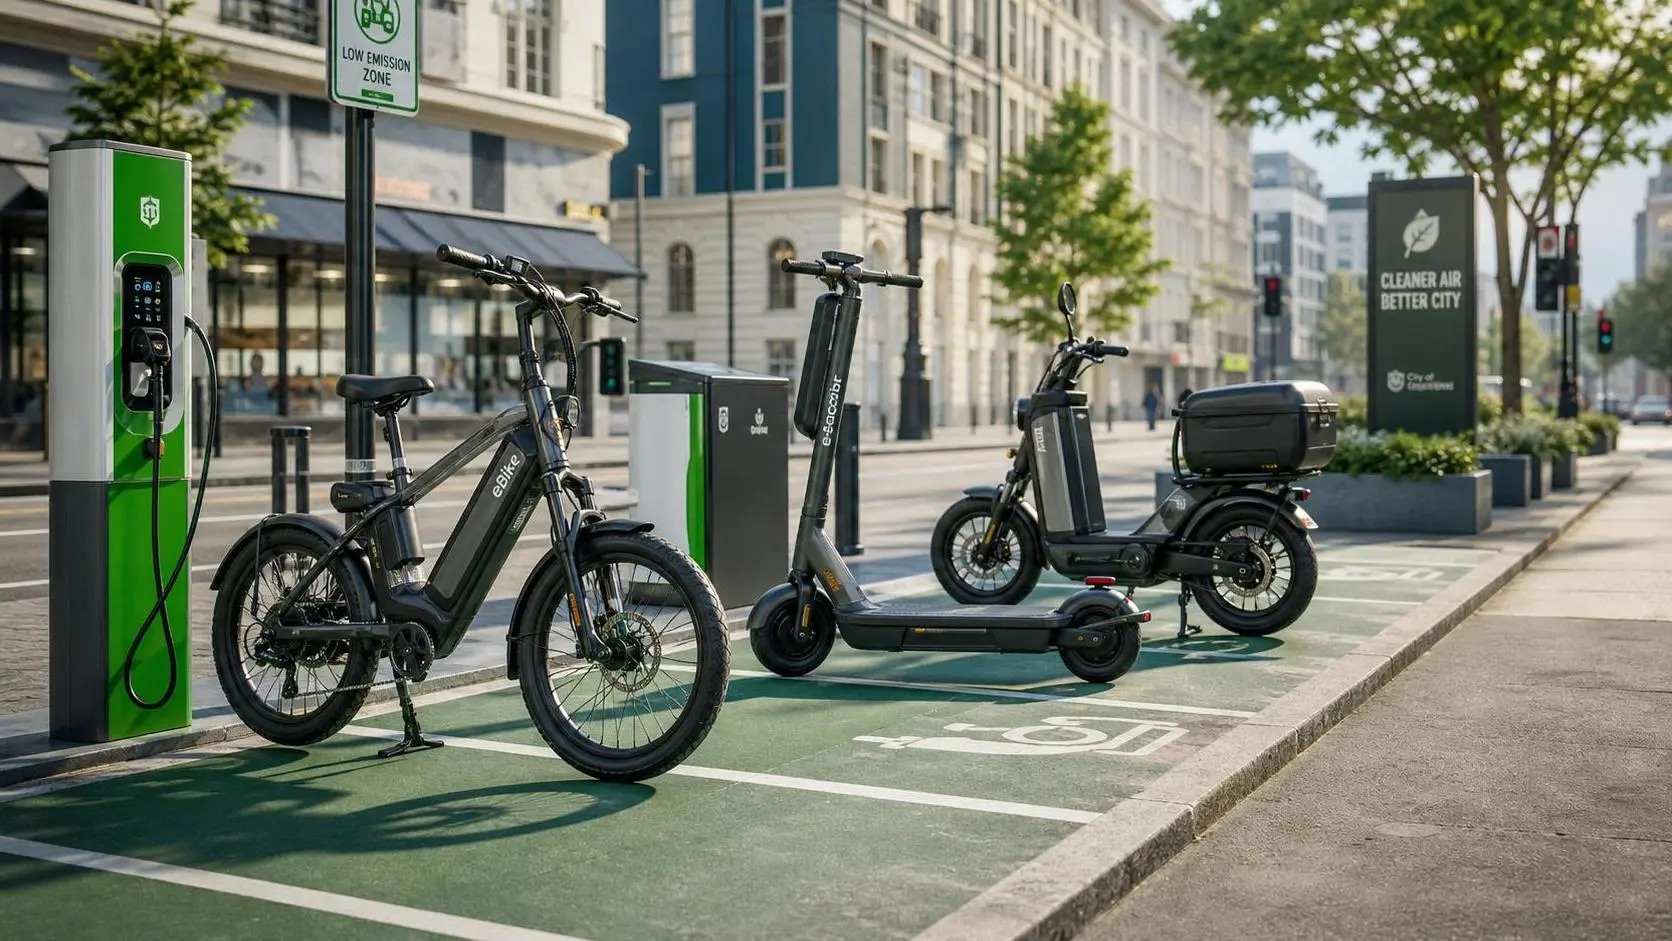
What Is Driving Green Two-wheelers Demand in Europe? Policy, Fuel Costs, and Buyer Segments
Green two-wheelers demand Europe is rising as policy support, fuel cost pressure, and diverse buyer segments reshape urban mobility. Explore the trends driving the next growth wave.
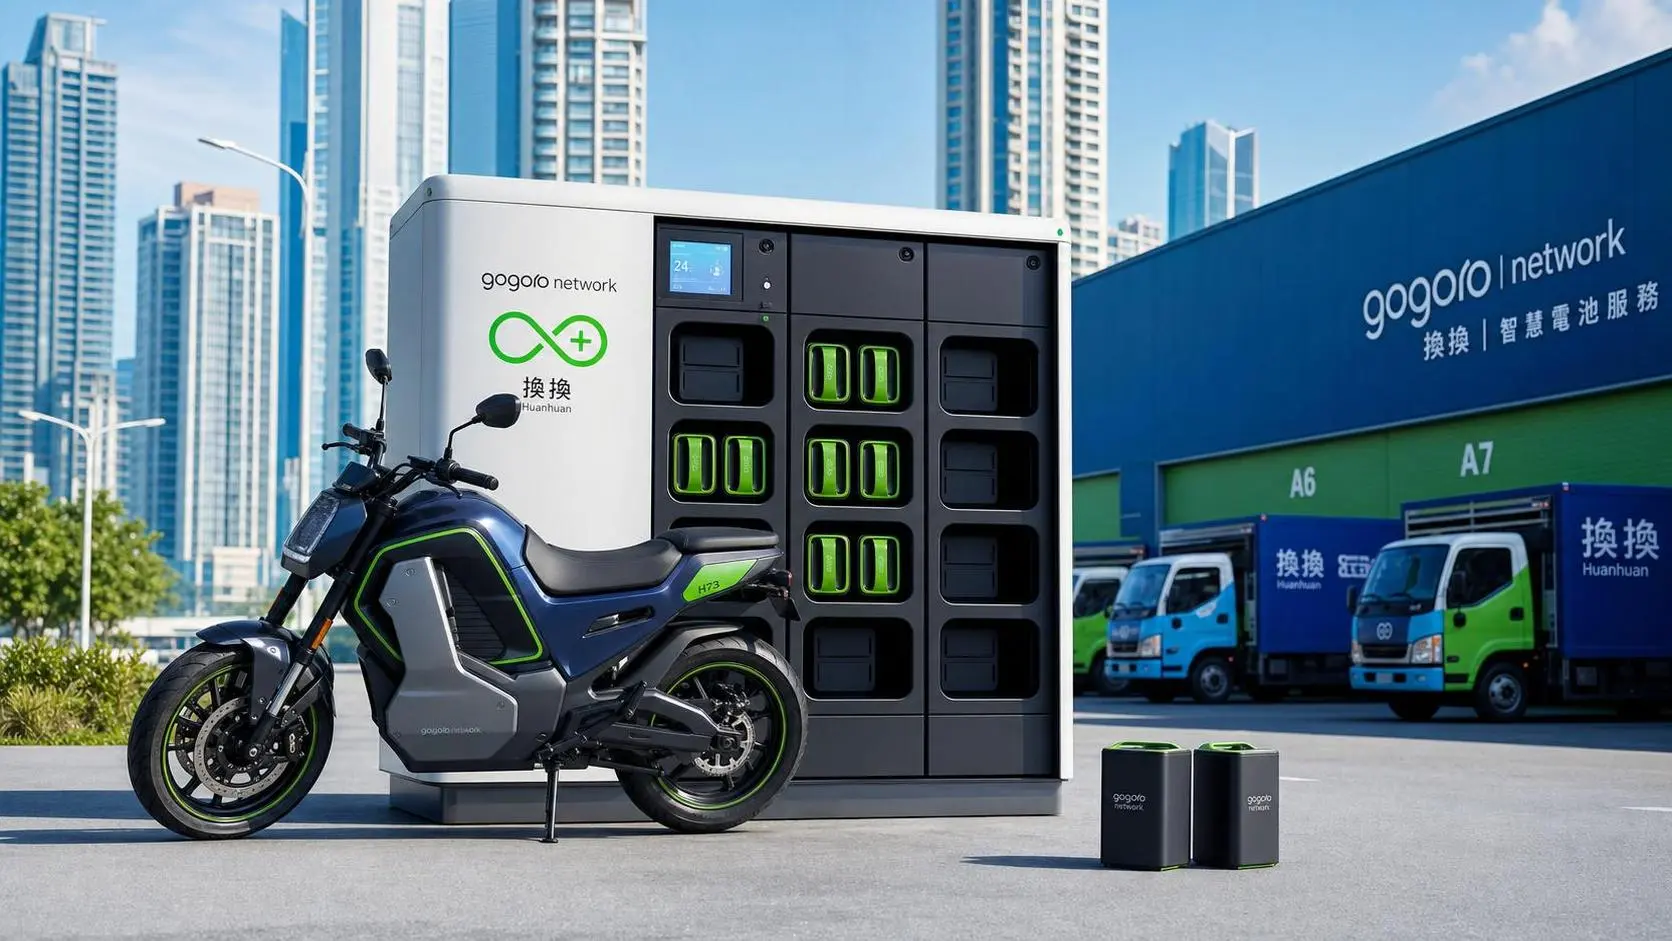
High-speed Electric Motorcycles with Swappable Battery: What to Check Before Commercial Deployment
High-speed electric motorcycles with swappable battery: learn what to verify before commercial deployment, from swap uptime and battery safety to compliance, serviceability, and real fleet ROI.
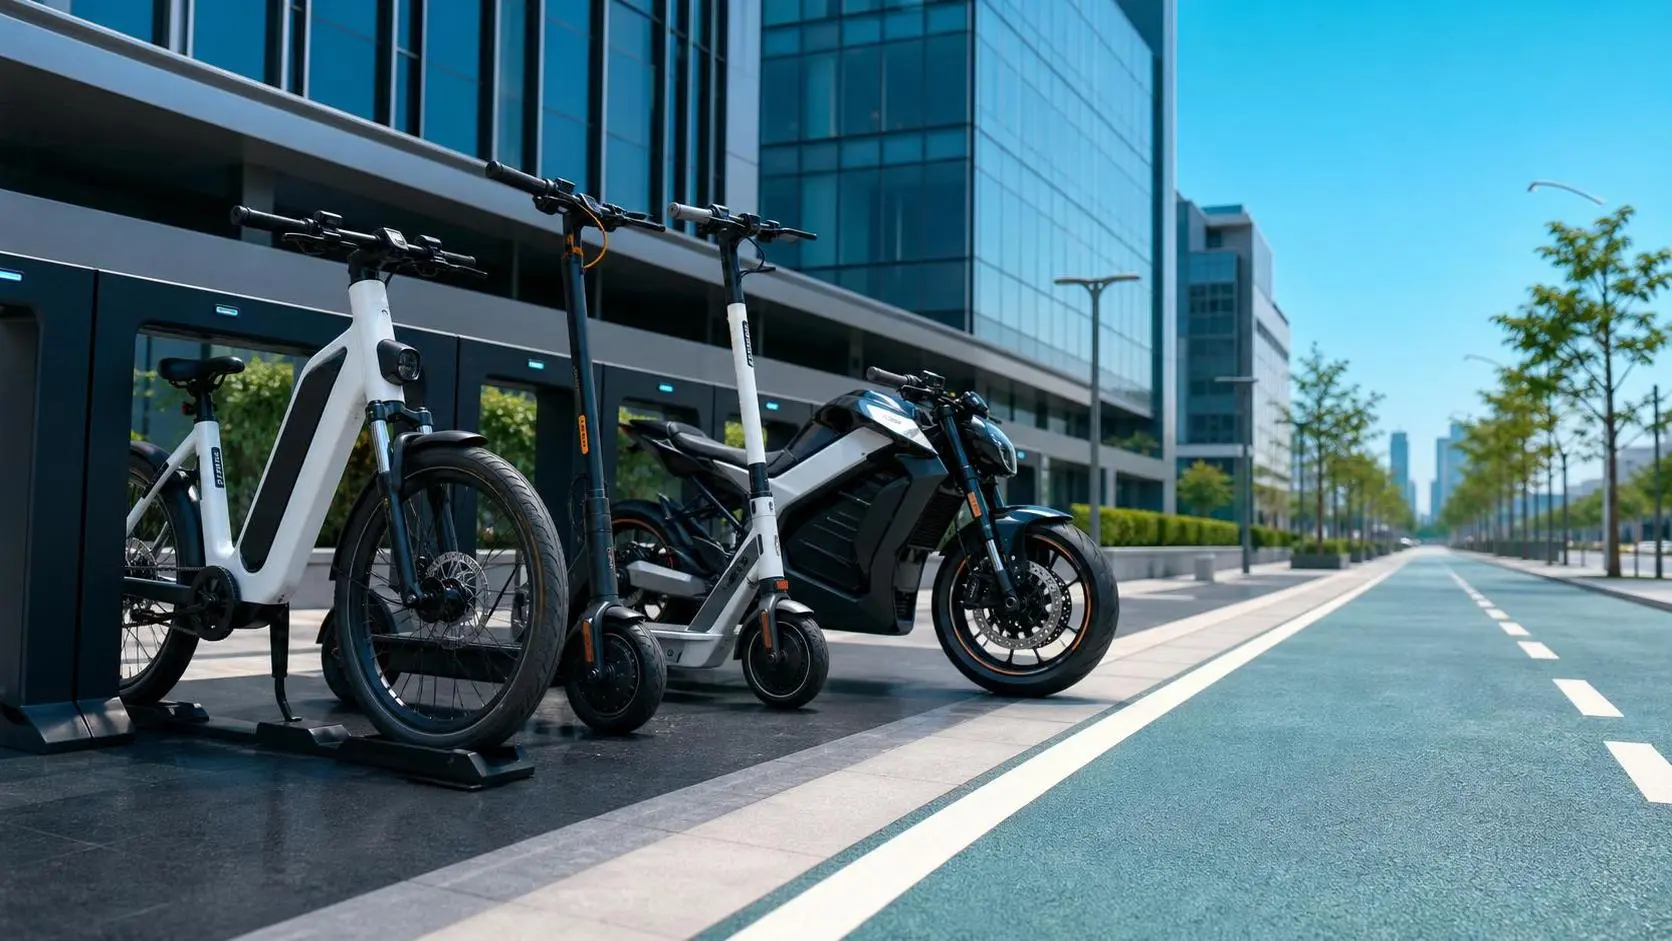
Micro-mobility Systems Explained: Core Components, Operating Models, and City Use Cases
Micro-mobility systems explained: discover key components, operating models, and real city use cases shaping cleaner, smarter urban transport and last-mile mobility.

How to Choose Urban Commuting E-bikes for Rental Fleets by Range, Durability, and Serviceability
Urban commuting e-bikes for rental fleets: learn how to compare real-world range, durability, and serviceability to cut downtime, lower fleet costs, and choose smarter bikes.

Battery Management Systems Factory Capabilities: How to Compare Testing and Traceability
Battery management systems factory comparison starts with testing depth and traceability. Learn how to evaluate BMS quality, firmware control, and risk reduction before choosing a supplier.
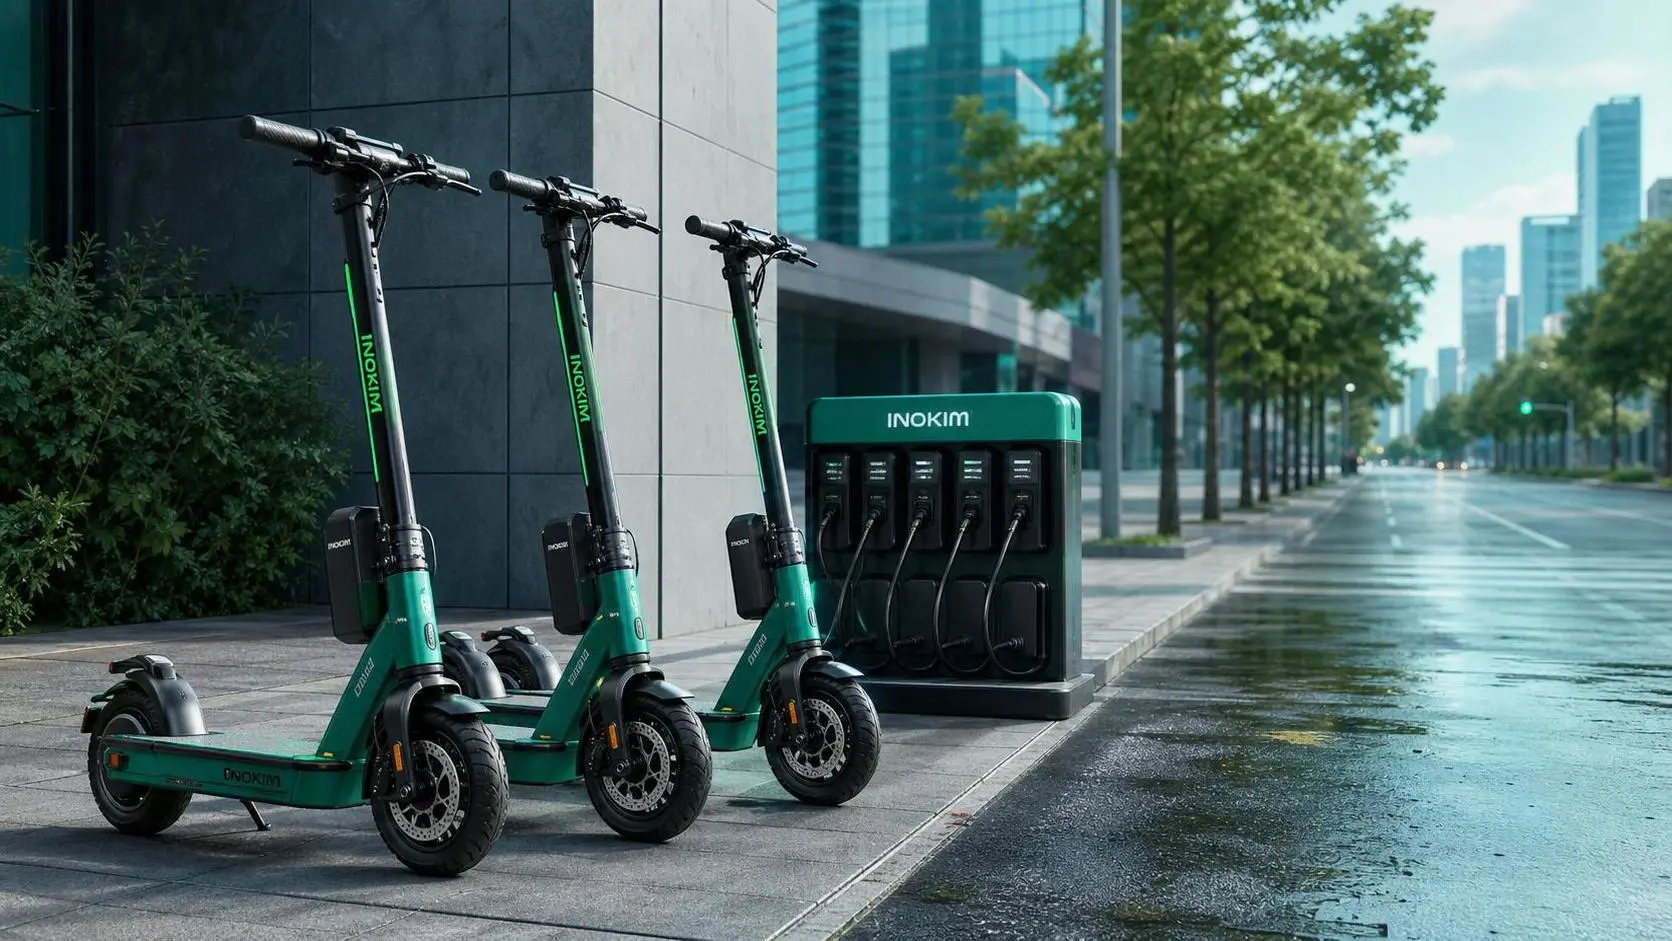
Green Transport Scooters for Urban Fleets: Which Specs Matter Most in Daily Use?
Green transport scooters for urban fleets: discover which specs truly drive uptime, safety, charging efficiency, and lower maintenance costs in daily city use.

OEM Market Share in Electric Motorcycles: What It Reveals About Brand Positioning
OEM market share electric motorcycles reveals far more than sales volume—discover how share shifts expose brand positioning, technology strength, pricing logic, and scalable growth potential.

Electric Drivetrain Systems Factory Audit Checklist: Key Quality Points Before Sourcing
Electric drivetrain systems factory audit checklist: learn the key quality, testing, traceability, and process checks buyers should verify before sourcing to reduce risk and choose reliable suppliers.

Micro-Mobility Solutions for Campuses: How to Choose the Right Fleet Model
Micro-mobility solutions for campuses: learn how to choose the right fleet model for safety, cost, charging, and rider demand to build a scalable, efficient campus transport program.